Tutorials
Microbiome Search Engine is a search-able database of microbiome for in-depth data mining of microbial community studies by data integration and data selection. It contains large scale of microbial community samples with sequences, meta-data and analysis results. Based on the query sample(s), Microbiome Search Engine will provide the matched entry sample(s) in the database with very similar community structures in an ultra-fast speed. In addition, samples in the database can also be sorted, selected, exported and downloaded by their sampling meta-data information (meta-data).
This reference microbiome database is being constantly updated and will be released periodically.
Microbiome Search Engine accepts the query sample that profiled into OTUs (for 16S rRNA gene) or species (for shotgun metagenome) or KEGG Orthologies (KO, for both 16S rRNA gene and shotgun metagenome).
Search by OTUs (for 16S rRNA gene)
16S rRNA gene amplicon sequences can be picked into OTUs against GreenGenes 13-8 (97% level) [1] reference by Parallel-META 3 (recommended) [2] or QIIME [3]. With a sequence file “sample1.fa”, you can get the OTUs using Parallel-META 3 by
$PM-parallel-meta -r sample1.fa -o sample1.out -f F
Then in the output directory "sample1.out", the result file "classification.txt" is qualified for upload and search.
The query file contains two columns: the OTUs and their sequence counts.
Example:
| 1082539 | 412 |
| 1023477 | 322 |
| 951711 | 164 |
Search by species (for shotgun metagemenome)
Metagenomic shotgun sequences can be annotated into species by MetaPhlAn2 (recommended) [4]. With a sequence file “sample1.fa”, you can get the species using MetaPhlAn2 by
$metaphlan2.py sample_1.fa --input_type fasta --tax_lev s --ignore_viruses --ignore_eukaryotes --ignore_archaea > profiled_sample_1.sp.txt
Then the output " profiled_sample_1.sp.txt " is qualified for upload and search.
The query file contains two columns: the species names and their relative abundance.
Example:
| s__Rothia_aeria | 10 |
| s__Actinomyces_naeslundii | 12.49 |
| s__Corynebacterium_matruchotii | 11.27 |
Search by KEGG Orthologies (for 16S rRNA gene and shotgun metagenome)
Sequences can be annotated into KEGG Orthologies (KO) by Parallel-META 3 (integrates a C++ implementation of PICRUSt 2 [5], recommended for 16S rRNA gene) or Humann2 (recommended for shotgun) [6].
a. With a 16S gene amplicon rRNA sequence file “sample1.fa”, you can get the KOs using Parallel-META 3 by
$PM-parallel-meta -r sample1.fa -o sample1.out
in the output directory "sample1.out", the result file "functions.txt" is qualified for upload and search.
b. With a shotgun sequence file “sample1.fa”, you can get the KOs using HUMAnN2 by
$humann2 --input sample.fa --output sample1.out
in the output directory "sample1.out", the result file "functions.txt" is qualified for upload and search.
The query file contains two columns: the KOs and their counts
Example:
| K01992 | 151 |
| K01990 | 146 |
| K06147 | 107 |
Microbiome Search Engine accepts the query sample that profiled into OTUs (for 16S rRNA gene) or species (for shotgun metagenome) or KEGG Orthologies (KO, for both 16S rRNA gene and shotgun metagenome). (See "How to pre-process your query sample")
In "Query" secion, firstly chose the search type from “OTU”, “Species” or “KO”. Then click the "Select" button choose the query file you want to search, or directly paste the content of the query file. There are 2 advanced options:
- Maximum matched sample number: The max matched sample number for visualization and download, default is 10;
- Minimum similarity:The min similarity value between input query and matched sample(s), default is 0.85. The similarity varies from 0.0-1.0, and higher similarity indicates more community structure shared by 2 samples.
Here we provide the demo query files for example runs. The taxonomical structure could also be viewed by clicking the “view” button.
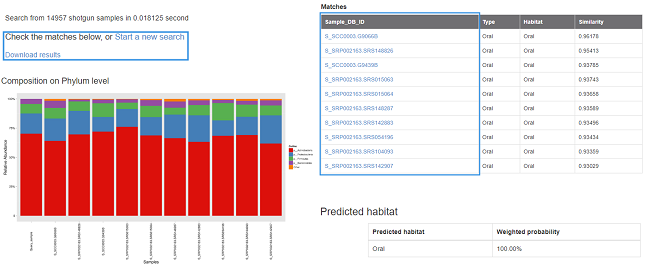
For OTU-based search (16S rRNA gene), the similarity between the query sample and the matched samples is calculated by Meta-Storms [7]; For species-based search (shotgun metagenome), the similarity is calculated by Dynamic Meta-Storms [8]; For function-based search (KO), the similarity is calculated by Bray-Curtis distance of KOs and pathways. The similarity varies from 0.0-1.0, and higher similarity indicates more community structure shared by the samples. Then the shared community composition and Multi-Sample-View [2] of your input query sample and the matched samples (s) can be illustrated and displayed in the result page. In addition, the searching results can also be downloaded with full community information including community feature tables and figures.
The search result is also available for download. In the download package “result.tar.gz”:
- query.out: The search results contains the top-matched samples’ ID and similarities to the query;
- Query_sample.OTU.Abd: The OTU relative abundance table of the query and matched samples (for OTU queries only);
- Query_sample.sp.table: The species relative abundance table of the query and matched samples (for WGS speices queries only);
- Query_sample.KO.Abd The KO relative abundance table of the query and matched samples (for functional queries only);
- Query_sample.phylum.Abd and Query_sample.png: The phylum-level relative abundance table and figure of the query and matched samples (for OTU or WGS species queries only);
- Query_sample.l2.Abd and Query_sample.png: The KO BRITE Level 2 relative abundance table and figure of the query and matched samples (for functional queries only);
- multi-view: Open the “taxonomy.html” in this folder for the detailed taxonomy of the query and matched samples (for OTU or WGS species queries only);
Microbiome Novelty Score (MNS) [9] is proposed to evaluate the compositional uniqueness of a microbiome sample when compared to all microbiomes in the database. A higher MNS means lower similarity to those microbiomes that have previously been sampled, suggesting higher novelty. If a microbiome has MNS ≥ 0.12 (mean MNS of 2010) then it is considered as "Novel" sample. MNS starts from 2010, and is not applicable for samples produced/published before 2010. Click here to check all Novel samples.
Microbiome Attention Score (MAS) is proposed to measures the connectivity of a given sample to all subsequent samples in the database. A higher MAS means more samples with similarity or samples with higher similarity had been sequenced, suggesting higher attention from the scientific community for this input sample. If a microbiome has MAS ≥ 10 (top 20%) then it is considered as "High-attention" sample. MAS starts from 2010, and is not applicable for samples produced/published before 2010. Click here to check all High-attention samples.
If a microbiome has the two attributes of a) MNS ≥ 0.12 when first sequenced and b) MAS ≥ 10, then it is considered as “Focus” samples. Click here to check all Focus samples. The combined MNS and MAS are quantitatively measured by Microbiome Focus Index (MFI):
Currently the MNS, MAS and MFI are only applicable for 16S rRNA gene samples.
The Microbiome Search Engine online system also provides the complete database meta-data, the search engine kernel standalone software (Meta-Storms 2) in Download.
- McDonald, D., et al., An improved Greengenes taxonomy with explicit ranks for ecological and evolutionary analyses of bacteria and archaea. ISME J, 2012. 6(3): p. 610-8.
- Jing, G., et al., Parallel-META 3: Comprehensive taxonomical and functional analysis platform for efficient comparison of microbial communities. Scientific Reports, 2017. 7: p. 40371.
- Hall, M. and R.G. Beiko, 16S rRNA Gene Analysis with QIIME2. Methods Mol Biol, 2018. 1849: p. 113-129.
- Truong, D.T., et al., MetaPhlAn2 for enhanced metagenomic taxonomic profiling. Nat Methods, 2015. 12(10): p. 902-3.
- Langille, et al., Predictive functional profiling of microbial communities using 16S rRNA marker gene sequences. Nature Biotechnology, 2013. 31(9): 814-821
- Abubucker, S., et al., Metabolic reconstruction for metagenomic data and its application to the human microbiome. PLoS Comput Biol, 2012. 8(6): p. e1002358.
- Su, X., J. Xu, and K. Ning, Meta-Storms: Efficient Search for Similar Microbial Communities Based on a Novel Indexing Scheme and Similarity Score for Metagenomic Data. Bioinformatics, 2012.
- Jing, G., et al., Dynamic Meta-Storms enables comprehensive taxonomic and phylogenetic comparison of shotgun metagenomes at the species level. Bioinformatics, 2019
- Su, X., et al., Identifying and Predicting Novelty in Microbiome Studies. MBio, 2018. 9(6).